
One Year In: Taming the Waveform Tsunami with AI Agents

Waveform debugging is one of the hardest problems in chip verification. Modern simulations generate terabytes of trace data, where one missed signal transition can cost weeks of re-spin time.
See how Waveform Agents have saved millions of debug hours in just one year.
TL;DR
Today's semiconductor designs generate terabytes of simulation data, while increasingly complex multi-die and 3D IC architectures create signal interactions too intricate for manual analysis alone. At the same time, critical design context remains fragmented across RTL, testbenches, logs, assertions, and waveform viewers, forcing engineers to reconstruct failures across disconnected tools and datasets.
Generic AI coding agents, without deep RTL and chip verification domain knowledge, struggle to reason across massive waveform datasets, understand hardware-specific behaviors, or maintain debugging context across long verification cycles. Simply feeding entire waveform databases into an LLM is neither scalable nor effective.
ChipAgents' Waveform Agents enable a more scalable and reliable autonomous debugging workflow for waveform debugging. Innovations such as selective waveform extraction, cross-file signal tracing, and autonomous regression triage allow Waveform Agents to operate efficiently even on terabyte-scale simulations. Waveform Agents can also detect a wide range of issues, from functional failures to assertion violations, whether in the design or testbench, without requiring specific error syntax or predefined signatures.
Why Verification Engineers Could Lose Days on Waveform Bugs
A regression run completes with failures, you then open the waveform viewer, locate the offending signal, and trace backward through the hierarchy. An hour later, you are three tool switches deep. The bug may be in the design. It may be in the testbench. It may be a parameter misconfiguration four modules up the hierarchy. The root cause could be in the design, the testbench, an interface protocol violation, or a parameter misconfiguration several modules upstream. Without a system that understands how these artifacts relate to one another, you are forced into hours or even days of manual correlation and guesswork.
If this sounds familiar, you are not alone.
Advanced SoCs generate waveform dumps that routinely reach hundreds of gigabytes, sometimes terabytes, per simulation. Yet the signals that actually explain a failure may represent less than a fraction of a percent of the dataset. At that scale, waveform debug stops being a visualization problem and becomes a search problem that human patience alone cannot solve.
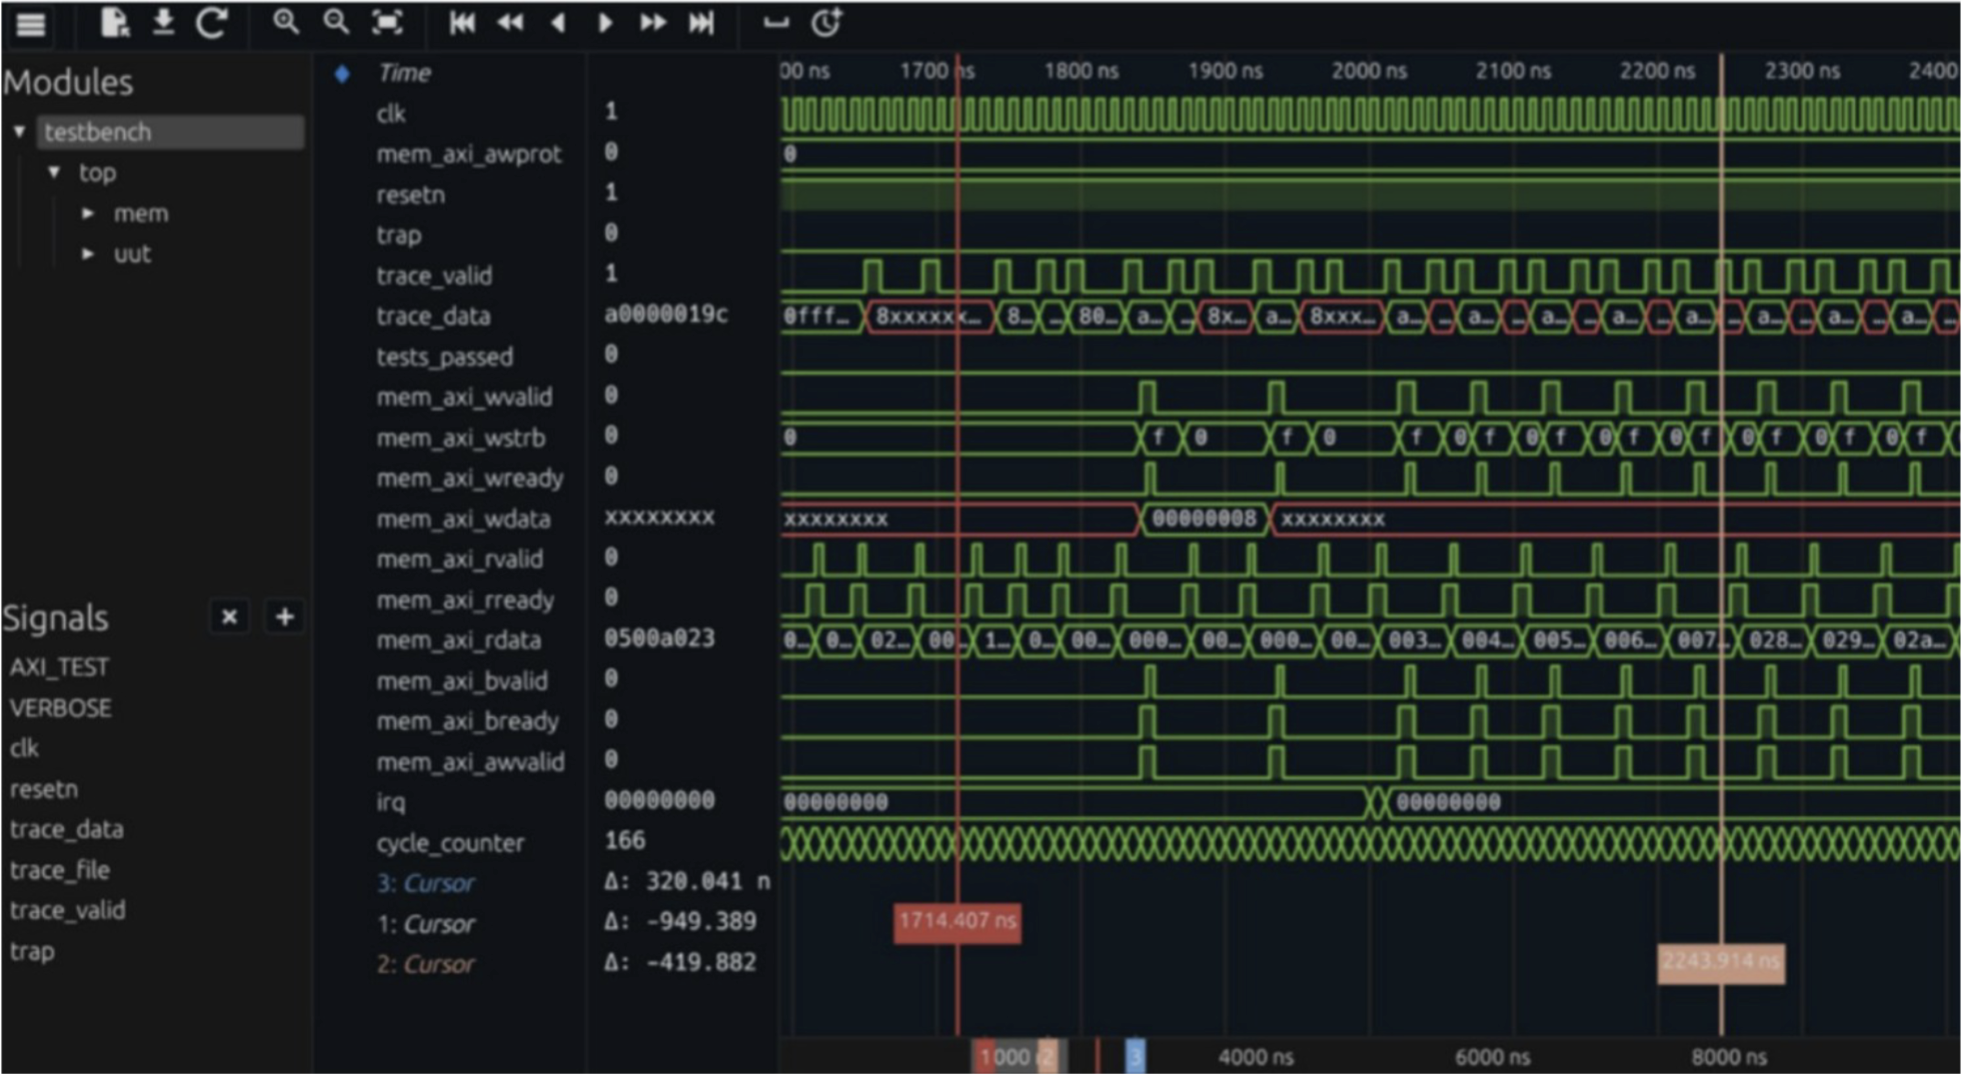
Figure 1. Waveform debugging
The deeper issue is that waveform debugging requires reconstructing causality across disconnected artifacts: waveform activity, RTL logic, assertions, connectivity graphs, configuration settings, and testbench behavior. Existing tools expose these domains separately, leaving engineers to mentally stitch together the relationships themselves. As designs grow more complex, that cognitive burden scales faster than engineering teams can keep up.
A Closer Look at Waveform Debugging Complexities
Four interlocking challenges define why even experienced engineers find waveform debugging so difficult.
The Data Scale Problem
Waveform data in modern semiconductor design routinely reaches hundreds of gigabytes or even terabytes in size. A single simulation run across a complex SoC can generate trace data that dwarfs most other engineering artifacts. This sheer volume creates a fundamental needle-in-a-haystack problem: the signals that contain evidence of a bug represent only a tiny fraction of the total dataset. Engineers must sift through massive, largely uneventful traces to locate the handful of cycles where something went wrong.
Cross-Reference Complexity
Locating an anomalous signal transition is only the beginning. Effective debugging requires cross-referencing waveform data against connected design and testbench files including RTL source, assertions, stimulus, coverage models, and more. A signal misbehaving in the waveform viewer may have its root cause buried in a testbench sequence, a parameter misconfiguration, or a subtle RTL condition several levels of hierarchy away. Moving between the waveform viewer, RTL editor, testbench, and assertion log forces the engineer to mentally reconstruct the relationship between what they see in each tool. Every switch costs time and introduces the possibility of losing the causal thread.
Deep Domain Knowledge Requirements
Fixing bugs uncovered through waveform analysis demands more than pattern recognition — it requires deep knowledge of signal interactions, their roles within the design and testbench, and how they interconnect across the hierarchy. A signal's behavior is rarely self-explanatory in isolation. It depends on protocol context, clock domain relationships, handshaking conventions, and design intent. This expertise takes years to develop, and even senior engineers can spend hours tracing signal dependencies before arriving at a fix. For complex interactions spanning multiple clock domains, protocols, and hierarchy levels, the cognitive load of maintaining a complete mental model exceeds what a single engineer can sustain.
Limited Regression Triage Capacity
A nightly regression with thousands of tests produces a failure list that takes longer to manually triage than the time available before the next run. Teams end up ignoring low-priority failures, missing intermittent bugs, and carrying unresolved failures across multiple regression cycles. Each process adds more uncertainty to the design's actual verification status.
AI to the Rescue, But Not Those Generic AI Agents
The promise of AI-assisted debugging is promising. But not all AIs are trained equal. People find generic AI agents have three limitations.
They Were Not Built for Binary, Structured EDA Data
Waveform files are binary, highly structured, domain-specific formats — VCD, FSDB, SHME — not source code or natural language text. Generic AI agents have no tooling to parse, index, or query these formats efficiently. Even if context window size were not a constraint, feeding raw waveform data to a general-purpose LLM produces poor results because the model has no trained intuition for what signal patterns are meaningful, what constitutes an anomaly, or how to map a waveform segment back to a design condition.
They Lack RTL and EDA Domain Depth
Claude Code is optimized for software codebases — Python, JavaScript, systems code. It understands functions, classes, APIs, and call stacks. It has no native understanding of RTL semantics, hardware simulation paradigms, clock domain crossings, VCD/FSDB/SHME waveform formats, UVM testbench architecture, or the relationship between a toggling net and its role in a protocol handshake. When asked to reason about why a ready-valid interface stalls or why a CDC signal is metastable, a generic agent can produce plausible-sounding text but lacks the grounded structural understanding needed for a reliable diagnosis. In semiconductor debugging, a confident wrong answer is worse than no answer.
They Cannot Navigate the Full Design Hierarchy
Effective waveform debugging requires simultaneous awareness of the waveform data, the RTL that generated it, the testbench driving it, the assertions monitoring it, and the connectivity graph tying signals together across hierarchy levels. Generic agents have no native model of how these artifacts relate to one another in a semiconductor project. They can read individual files if pointed to them, but they cannot autonomously traverse a design hierarchy, resolve signal paths across module boundaries, or understand that a bug visible at one abstraction level has its root cause three levels deeper. They treat each file as an isolated document rather than as a node in a deeply interconnected design graph.
What Waveform Agents Do Differently
Waveform Agents are not a general-purpose LLM applied to an EDA problem. They are a domain-specific agent architecture built around the actual structure of waveform debugging workflows.
Intelligent Context Selection
Rather than attempting to load entire waveform databases into a context window, Waveform Agents use purpose-built EDA tooling to selectively extract relevant segments. The agent identifies the time window, signal set, and hierarchy scope most likely to contain diagnostic information — then loads only that context. This is not a workaround for context window limitations; it is a structurally correct approach to a problem where the relevant data is always a small fraction of the total dataset. The agent finds the needle. The engineer does not need to specify which part of the haystack to search.
Cross-File Signal Tracing
Waveform Agents traverse design and testbench files, log files, and waveform data as a connected graph, not as isolated documents. When a signal anomaly is identified in the waveform, the agent can follow that signal's ancestry through the RTL hierarchy, examine the testbench sequences that drove it, and check the assertions monitoring it — without the engineer switching tools or manually reconstructing relationships. The correlation that costs engineers' hours of context switching happens automatically, within a single debugging session.
Design-Aware Reasoning
Agents trained on semiconductor domain knowledge understand RTL semantics, protocol handshaking, clock domain relationships, and UVM testbench architecture. When an agent identifies an anomaly, it reasons about that anomaly within the design's actual context, not as an abstract pattern-matching exercise. This distinction matters when a wrong diagnosis sends an engineer down a multi-hour investigation path. Domain-grounded reasoning produces diagnoses engineers can act on.
Start With the Failures That Are Costing the Most Time
Begin with the two changes that remove the most debugging overhead immediately: replacing manual waveform slice selection with agent-driven intelligent extraction and replacing cross-tool manual correlation with integrated cross-file signal tracing. Those two shifts make failures locatable without requiring the engineer to already know where to look and make root causes traceable without requiring manual context reconstruction across tool switches.
From there, adding automated regression triage before the next nightly run produces a failure list that exceeds the team's manual triage capacity. The value of agent-driven first-pass triage compounds with regression scale: the larger the regression, the more time automated triage saves, and the more consistently intermittent failures get surfaced rather than dropped.
Designs are getting larger, schedules are not getting longer, and the tools engineers have been given were designed for a smaller problem.
Waveform Agents are not a complete solution to verification complexity, but they enable a significant reduction in the manual overhead that consumes the time engineers need for higher-value design work.